
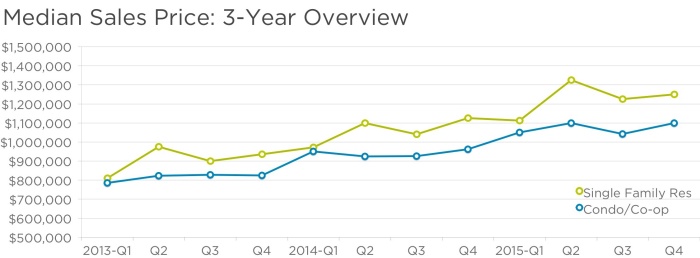
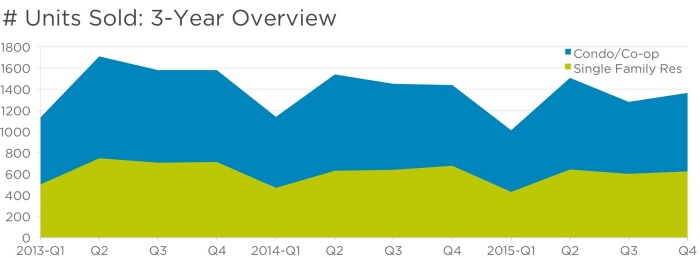
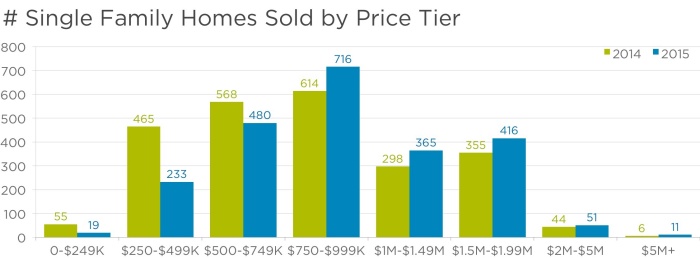
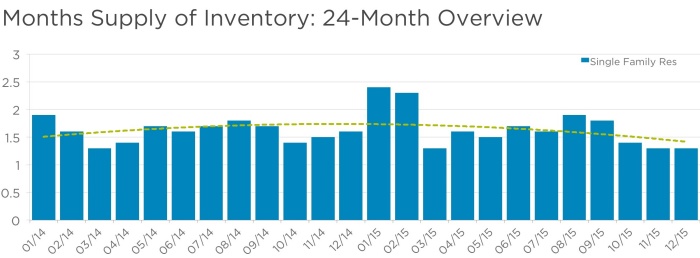
Happy New Year! It’s that time of year when it’s only natural to take a look back over how the past year has been. With real estate, taking a bit longer view can often shed greater insight. We’ve pulled some numbers to take a look back over the past three years. We know the real estate market has had a lot going on, but taking just a slightly longer view really puts into perspective just how heated things have been. Some of the most notable numbers when we look back to the first quarter of 2013 compared to the last quarter of 2015: single family home prices increased 35.2%; condo/co-op/loft prices increased 28.6%. Average days on market decreased by 40% for single family homes and 36% for condos/co-ops/lofts. Despite low inventory being an ever-present issue, number of homes sold increased by 20% while condo/co-op/loft sales increased by 14.5%. The impact of inventory can definitely be seen in the Months Supply of Inventory (MSI) metric, which is a measure of the number of months it would take the current inventory of available homes to sell out given the current rate of sale. In that time period, MSI for single-family homes dropped 46.2% down to just 1.3 months.
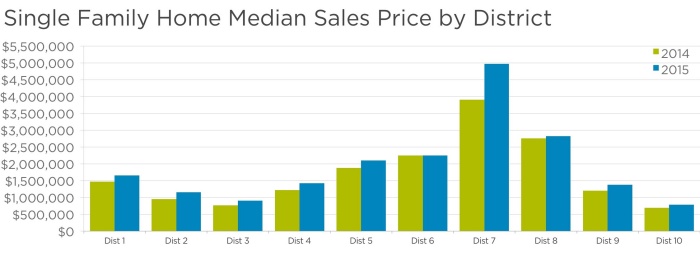
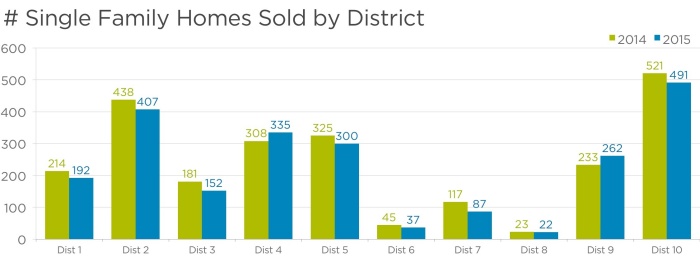
When viewed by district, rather than the City as a whole, numbers can vary more significantly as you’ll see in the Median Sales Price by District chart below. It’s a year-over-year comparison of 2014 vs. 2015. While many districts saw notable increases in single family home sales price, there were a few exceptions to the rule where prices saw very slight increases or even remained relatively flat, which just reinforces what we always say: real estate is hyper-local. What’s happening on a city-wide level may be different in your neighborhood or even your own block.
San Francisco Market Update January 2016

[Data Source: San Francisco Association of Realtors Multiple Listing Service (SFAR MLS), 1/1/13 through 12/31/15 or period noted in chart, for Citywide San Francisco.]
To get a thorough analysis of what’s happening in your area and how it impacts your own property’s value, please contact our office.